
Filter a Column With Values of Another Column Using DAX Instead of Many to Many Relationship

So you want to filter a column in table A with values in a column in table B, but both contain duplicated data, the many to many can resolve this but I don't think this is your best approach so let's discuss how you can get around this.
- why you may not want to use Power BI Many to Many even though you think you do:

so here I'm going to introduce two approaches to solve this one that Patrick has already introduced
and that one I've found using DAX and it is mind-blowing!
- First, let's look at the kind of ambiguity I'm talking about:
 |
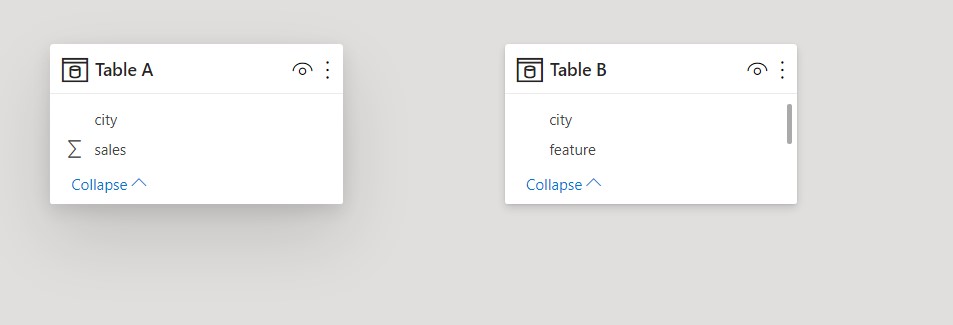
| Here I've created some dummy data where table A and B contains city column A with the sales of each city Both columns contain the city name more than one so it introduces many to many relationship |
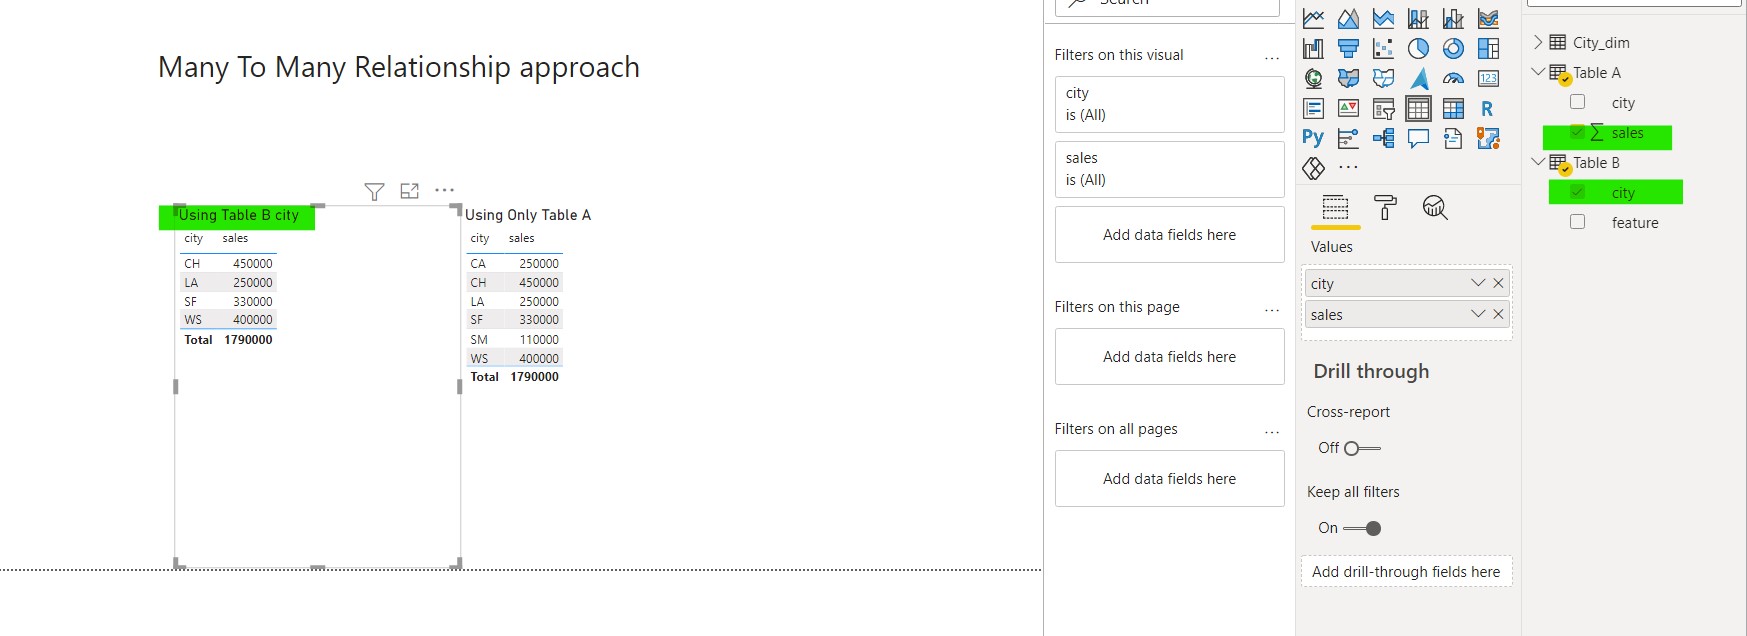 |
| So here is what happened, it filtered the data right but the total in the table which I used city from column B is the same as the grand total of table A which makes no sense |
- The First Approach: Creating a separate dim table:
You can create a dim table by taking the unique values of the table you want to filter by (or both tables) in a separate dimension table
 |
| Here I've created a dimension table of only the unique names of the cities in table B So I can filter table A with them in a one to many relationship |
 |
| And of course, it introduces blanks that represent the values that are not in table B so you can easily remove these blanks from the filter. |
- The second approach which is my favorite is using DAX:
 |
| Without any relationship! |
 |
| And without any filter and it works just fine |
Here's the measure used for that filtering:
sales for cities in table B =

var A = VALUES('Table B'[city])

RETURN

CALCULATE(SUM('Table A'[sales]),FILTER('Table A','Table A'[city] IN A))
What this measure is doing is that it is taking the unique values of Table B city columns, stores them in variable A, then calculates the sales of table A cities filtered with these values. and it works just fine without even introducing a relationship.
Leave me a comment if you've tried or if you have a better approach.
Regards.


Comments
Post a Comment